Volunteers helped reveal the full picture of the state of our Tawny Owls by taking two short evening visits to squares available across the UK.

Why survey Tawny Owls?
Despite being widespread, we know surprisingly little about our Tawny Owl population. The BTO's core monitoring schemes do suggest a recent decline but as they are daytime surveys, they can't show us the full picture. We get better information on how Tawny Owl populations are doing by carrying out periodic targeted surveys.
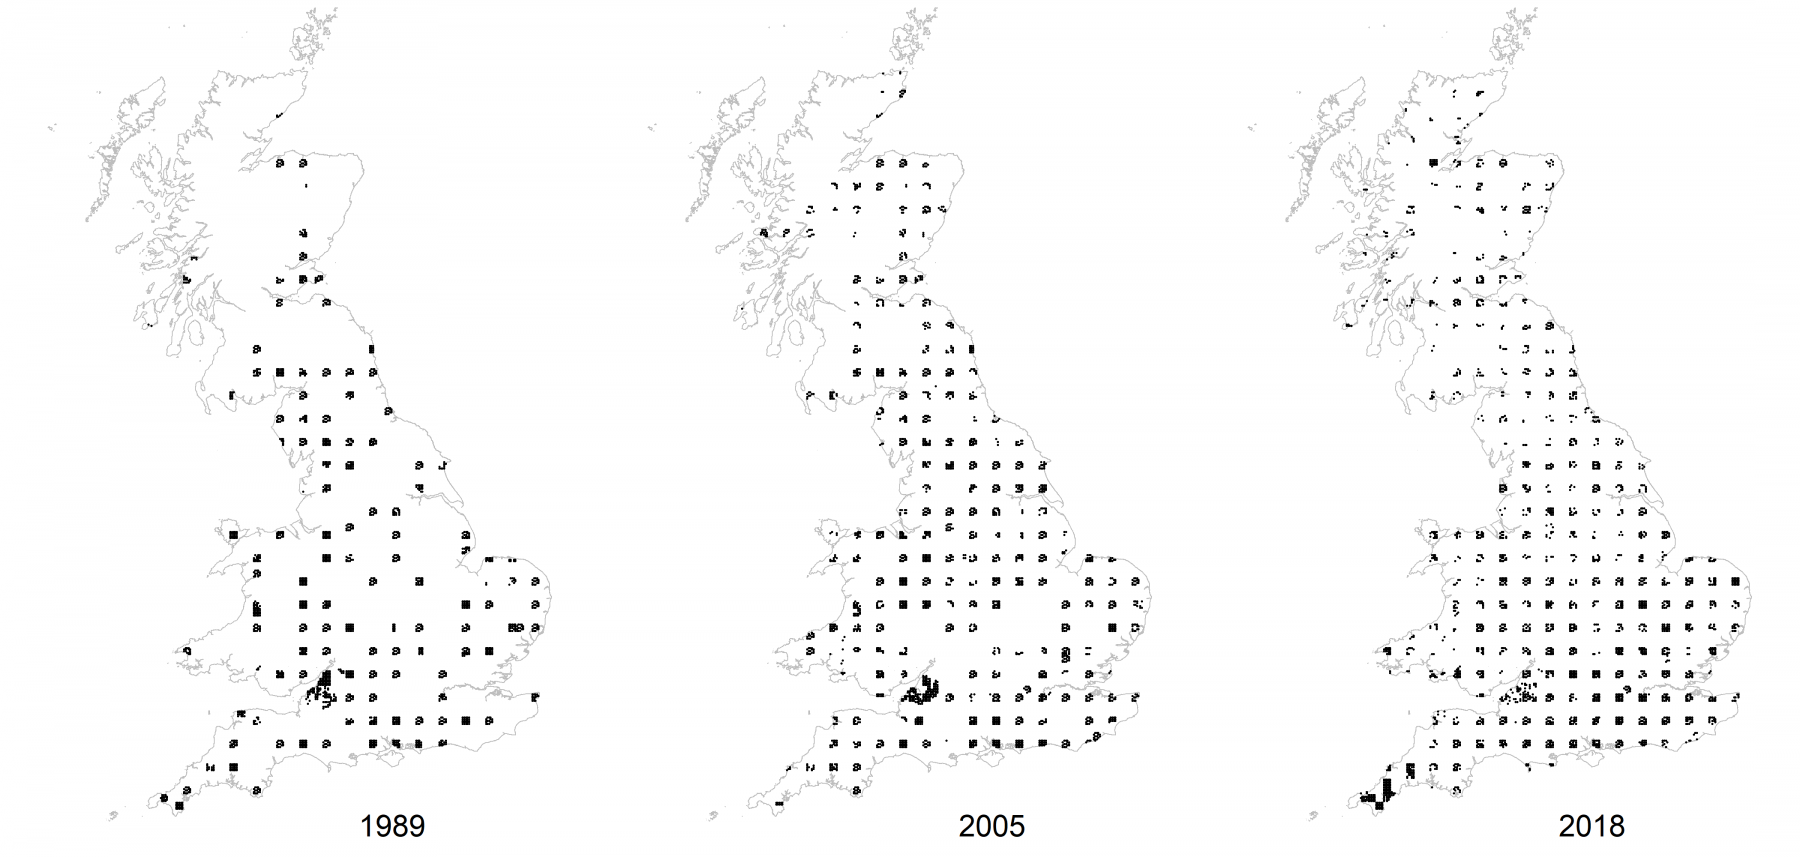
BTO previously carried out national structured surveys for Tawny Owls in Britain in the autumns of 1989 and 2005. So by carrying out a comparable survey in autumn 2018 (August 15th - October 15th 2018) that also takes advantage of modern statistical techniques, we aimed to get an up-to-date measure of change in their occupancy and populations as well as habitat associations and geographical patterns. Through this, we hope to learn more about our noisy but often mysterious neighbours.
Tawny Owl Point Survey structure
This survey involved volunteers visiting random preselected tetrads (2x2km squares). In total there were over 6,000 tetrads available at the start of the survey, of which approximately 2650 were surveyed previously in 1989 and/or 2005. Over 3000 of these tetrads were surveyed during autumn 2018 making it the largest and most in-depth survey of Tawny Owls ever.
Provisional results
Survey background and overview
We had a brilliant response to our 2018 Tawny Owl Point Survey (TOPS), with data submitted for over 2900 tetrads and presented in these provisional results. Before looking at these, it’s worth remembering how TOPS was different to a typical BTO survey.
Most of our single-species surveys operate on the premise that each surveyor will find most of the birds in their designated site, and with relatively simple calculations, we can estimate the total population size. Such an approach makes the assumption that sites without any detections are unoccupied. This is very unlikely to be true for Tawny Owls because they are hard to detect unless actively calling, and even then, hard to count fully in an area, and so any survey treating non-detections as absences would likely underestimate the true number of owls.
Playing recordings to elicit a response increases the chance of detecting owl presence in site-based studies, but even playback does not guarantee a 100% response rate. Furthermore, owl response rates would depend on factors like playback volume, which would be extremely difficult to standardise across a national survey involving thousands of volunteers (moreover, it wasn’t done in previous surveys and would make comparisons tricky).
Estimating owl detectability and occupancy
Instead, TOPS and the previous owl surveys used multiple, short timed-counts with the certain knowledge that owls would sometimes be missed in occupied territories. Because owls are detected on some surveys and not on others (even if they might be present), we are able to estimate the detectability of owls, and knowing this allows us to interpret visits where no owls were detected. For example, if you make three visits to an occupied territory but only detect an owl on the third, it gives us an insight that owls may be detectable only 33% of the time.
It may be frustrating in the field to fail to detect an owl you know is present, but be assured that the survey has been designed to deal with this, and we use a well-established statistical technique called Occupancy-Detection Modelling to estimate both the detectability of owls and the average occupancy of tetrads. While a survey designed in this way can’t say with certainty which of the tetrads without any detections were occupied, it does a much better job at robustly estimating the percentage of tetrads occupied and how this has changed through time.

Results
- Please note that these results are provisional, and we still need to look at the numbers of owls and differences between countries and habitats.
Analyst Dario Massimino has found that the estimated percentage of squares occupied, which was around 63–64% in 1989 and 2005, appears to have dropped to 54%.
Further work will refine these national figures, but it’s because of the efforts of thousands of volunteers consistently following a simple protocol, some finding owls, others being “zero heroes”, that we will be able to produce high-quality trends for Tawny Owls in Britain.